
|
|
1.IntroductionNature provides different species of fruits, vegetables, and flowers that contain natural dyes that can be extracted and employed in dye-sensitized solar cells (DSSCs). Anthocyanin pigments are responsible for the red, purple, and blue colors of many fruits, vegetables, and flowers. Botanists have studied these pigments for a long time because they act as pollination attractants and phytoprotective agents. Nutritionists and horticulturists continue to study these compounds because of their obvious importance to the color quality of fresh and processed fruits and vegetables.1 Anthocyanins absorb blue, blue-green, and green light. Therefore, the light reflected by objects containing anthocyanins appears red. The basic chemical formula for anthocyanin dyes is C15H11O+. Anthocyanins are mainly composed of 3-glucosides of the anthocyanidins and are subdivided into the sugar-free anthocyanidinaglycones and the anthocyanin glycosides. As of 2003, more than 400 anthocyanins had been reported, whereas more recent literature puts the number at more than 550 different anthocyanins. The advantages of anthocyanin dyes include their availability and low cost. To date, raw anthocyanine extracts are among the most successful natural sensitizers for solar cells. These organic dyes generate high monochromatic photon-to-current conversion yields. Numerous efforts have been made by several research groups all over the world to utilize natural dyes as sensitizers in a new generation of solar cells. In an experiment, Cherepy and colleagues2 concluded that electron recaptures by the redox mediator and light screening mechanisms may limit the efficiency of a photoelectrochemical cell that utilizes an anthocyanin dye-sensitized TiO2 nanocrystalline electrode. In this study, the authors compared the photon-to-current efficiency measured for the solar cell with the efficiency estimated from the injection and recombination rate constants. In another study,3 the DSSCs were assembled using natural dyes as sensitizers that were extracted from black rice, capsicum, erythrinavariegata flower, rosaxanthina, and kelp. In this experiment, the authors observed that the black rice extract demonstrated the best photosensitized effect, which was due to the better interaction between the carbonyl and hydroxyl groups of the anthocyanin molecules from the black rice extract and the surface of the TiO2 porous film. A different study demonstrated that solar cells sensitized by Jaboticaba and Calafate extracts could generate significant photocurrent. The authors of this study concluded that only selected extracts are capable of converting sunlight to electricity.4 Wongcharee and colleagues investigated the DSSCs that were made using a mixture of natural dyes extracted from rosella, blue pea, and other extracts. The mixed extract adsorbed on TiO2 did not show synergistic light absorption and photosensitization compared to the individual extracts. Instead, the cell sensitized with the rosella extract alone showed the best sensitization, which was in agreement with the broadest spectrum of the extract adsorbed on the TiO2 film. The authors reported that changing the pH and extracting temperature of the dye improved the efficiency of the rosella extract-sensitized DSSC.5 Furthermore, investigators assembled DSSCs using red Sicilian orange juice (Citrus Sinensis) and the purple extract of eggplant peels (Solanummelongena, L.) as natural sensitizers of TiO2 films. Conversion of solar light into electricity was successfully accomplished with both fruit-based solar cells.6 Kumara and colleagues experimented with a DSSC made by coating pigments from a shiso leaves extract on a nanocrystalline film of TiO2 and subsequent deposition of p-Cul. Both shisonin and chlorophyll contributed to light energy harvesting as seen from the photocurrent action spectrum of the cell. This experiment was an example of synergistic sensitization using a dye cocktail extracted from a single natural resource.7 Another group of investigators compared natural carotenoids, crocetin (8,8′-diapocarotenedioic acid), and crocin (crocetin-di-gentiobioside) as sensitizers in DSSCs. In this study, photoelectrochemical properties of two carotenoids, one with a carboxylic acid group and one without, were investigated. Investigators concluded that crocetin, whose structure contains carboxyl groups, can effectively attach to the surface of the TiO2 film, resulting in higher photoelectrochemical performance than crocetin, which does not have a carboxylic group in its structure.8 It is necessary to search nature to find additional organic resources that are capable of generating more power when used as dye sensitizers in solar cells. The first step is to build a model that predicts the efficiency of a DSSC based on the qualitative and quantitative characteristics of organic dye sensitizers. This study investigated the relationship between anthocyanin concentration in a series of organic fruit species and the photoelectrochemical performance of the DSSCs sensitized using these dyes. We hypothesized that organic dyes with greater anthocyanin content will have a higher fill factor (FF) and a maximum output power (PMAX), which will lead to higher energy conversion efficiency. 2.Methods2.1.MaterialsA TiO2 film photoanode was prepared by blending ca. 0.2 g of commercial TiO2 powder (Degussa, P25), 0.4 mL of nitric solution (0.1 M), polyethylene glycol (MW10,000), and a nonionic surfactant, Triton X-100. The mixture was well mixed, and the resulting paste was spread over a conductive glass plate. The coated plate was then sintered at 450°C for 2 h. Anthocyanin dye solution was made by crushing and filtering a group of fresh fruits including blueberry, black raspberry, cherry, cranberry, blackberry, raspberry, strawberry, red grape, and orange in 2 mL of deionized water at room temperature (25°C). These test fruits represent a structural variety of major natural anthocyanins (Table 1).9, 10, 11, 12, 13, 14, 15, 16, 17, 18, 19, 20 The pH of all dye extracts was measured and adjusted to the lowest observed pH value, which was 3.5 for strawberry, using a 0.1M HCl solution. The dyes were adsorbed onto the TiO2 surface by immersing the coated electrodes in an aqueous solution of each dye for 24 h. The nonadsorbed dye was washed off with anhydrous ethanol. A counter electrode was prepared by deposition of a light carbon film on another piece of conductive SnO2-coated glass. This thin carbon layer served as a catalyst for the tri-iodide to iodide regeneration reaction. The catalyst-coated counter electrode was placed on the top so that the conductive side of the counter electrode faced the TiO2 film. The iodide electrolyte solution (0.5 M potassium iodide mixed with 0.05 M iodine in water-free ethylene glycol) was placed at the edges of the plates. The liquid was drawn into the space between the electrodes by capillary action. Light entered the assembly through the TiO2 side of the cell. Table 1Content of main anthocyanins in this study of fruits (from database: USDA 2007; Refs. 9, 10, 11, 12, 13, 14, 15, 16, 17, 18, 19, 20; mg_100g−1 fresh weight); Cyanidin (Cy), Pelargonidin (Pg), Malvidin (Mv), Petunidin (Pt), Peonidin (Pn), and Delphinidin (Dp).
2.2.MeasurementsThe output voltage of each solar cell was measured under sunlight illumination on August 4, 2009, at 12:50 PM in New York City (Temperature: 82.9°F, humidity: 56%, and wind speed: 6.9 mph). For all measurements, the input solar power was assumed to be 100 mW cm−2. The solar energy conversion efficiency (I–V curve) was measured by directly attaching a multimeter to the two sides of the cell. The negative electrode was attached to the TiO2-coated glass, and the positive electrode was attached to the counter electrode. Based on the I–V curve, the FF was defined as where Imax and Vmax are the photocurrent and photovoltage for maximum power output (PMAX), Isc and Voc are the short-circuit photocurrent and open-circuit photovoltage, respectively. The overall energy conversion efficiency (η′) was defined as where Pin is the power of sunlight, which was assumed to be 100 mW cm−2. The series (RS) and shunt (RSH) resistances were calculated from the slopes of the I–V curve at Voc and Isc, respectively. The inverse of the slope at Isc gives RSH and the inverse of the slope at Voc gives RS. Defining PMAX as the dependent variable, a series of step-wise linear, semi-logarithmic, quadratic, and power law regression models were used to investigate the relationship between the anthocyanin concentration and the photoelectrochemical performances.3.ResultsAmong the studied solar cells, the blueberry sensitized device had the highest FF (0.47) and conversion efficiency (ηMAX = 0.17%) and generated the PMAX (173.7 mV) at a Vmax = 278 mV and current density of Imax = 0.6 mA (Fig. 1). Solar cells sensitized using the organic dye extracted from strawberry, the fruit with the least anthocyanin content, had the lowest FF (0.37) and conversion efficiency (ηMAX = 0.07%) and produced the lowest PMAX (69.3 mV). The average PMAX for all devices was 173.7 mV. The device sensitized with orange dye did not generate any significant power (PMAX < 10 mV) (Table 2). Mean distribution of the six most common anthocyanins in this study are the following: cyanidin (23%), pelargonidin (1%), peonidin (2%), delphinidin (2%), petunidin (1%), and malvidin (4%) (Table 1). Regression analysis showed the significant relationship between PMAX and anthocyanin concentration at all linear (p value = 0.007), semi-logarithmic (p value = 0.0009), and quadratic fits (Table 3). These results showed that anthocyanin content and device performance might be related by a power-law relationship. The semi-logarithmic model showed that it fits the observed relation between anthocyanin content and device performance with a rapid increase in PMAX for modest anthocyanin content and decreasing improvements for high concentration (Fig. 2). The power law function of Y(x) = 20.4729 (X0.3706) can be used to model the performance behavior of DSSCs based on their anthocyanin content. This model shows a relation between anthocyanin content and device performance that approaches zero for zero concentration (orange-based device) and follows a sublinear increase for higher concentration (Fig. 2). The power law dependence with an exponent less than one (n = 0.3706) fits the data. Table 3R2 values and model characteristics obtained for the relationship between anthocyanin concentration (AC) and maximum power (PMAX) in the investigated DSSCs.
Table 2Performance of the investigated DSSCs with varying anthocyanin concentration in sunlight of 100 mW cm−2 intensity; AC (mg/100 g): anthocyanin concentration; PMAX: maximum power; VMP(mV): voltage at PMAX; IMP (mA cm−2): current at PMAX; Voc: open circuit voltage; IOC (mA cm−2): short circuit current; FF: fill factor; ηMAX,: maximum efficiency; RSH: shunt resistance; RS: series resistance.
Fig. 1Current–voltage (I–V) curve with concurrent power changes for each I–V sweep of six investigated DSSCs with anthocyanin concentration (mg/100 g) of the investigated dye extracts. (a) Blueberry, (b) cherry, (c) cranberry, (d) blackberry, (e) raspberry, and (f) red grape. PMAX: maximum power; VMP (mV): voltage at PMAX; IMP (mA cm−2): current at PMAX; Voc,: open circuit voltage; Isc (mA cm−2): short circuit current. 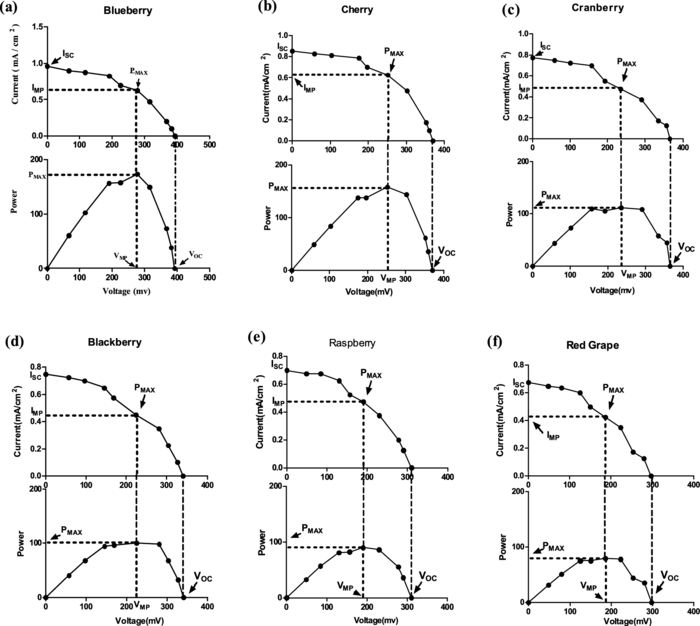 4.DiscussionIn a DSSC, sunlight enters the cell through the transparent SnO2 coated glass on the top, striking the dye on the surface of the TiO2 (Fig. 3). Photons striking the dye with enough energy to be absorbed will create an excited state, from which an electron can be directly transferred into the conduction band of the TiO2. From there, the electron moves by diffusion (as a result of an electron concentration gradient) to the clear anode on top. In this process, nanoparticles of anthocyanin dye act as the electron donors when activated by solar energy. The total electron releasing capacity of the dye depends on the density of the anthocyanin molecules ready to be activated. The semi-logarithmic model outlined in the current study raises the possibility of saturation effects. This study showed that all three higher concentration dyes (AC > 100 mg/ml) have power generation efficiencies of 0.15 to 0.17 mW. It seems that there is a threshold concentration for which greater values do not yield improved performance between 100 mg/100 and 300 mg/100 of anthocyanin content. Previous research works have shown that most natural events follow a power law. In this study, a power law model yields a better straight line and prediction (R2 = 0.86 versus R2 = 0.73 in linear model). Although a linear model can predict PMAX at low anthocyanin concentrations, a power law model is a better fit for the data and proves that PMAX leveled out as the anthocyanin content increases. When a majority of the ready anthocyanin molecules are activated, an increase in the concentration of anthocyanin molecules does not result in significant improvement of PMAX. A power law model has a significant fit (p = 0.0008) and shows that the anthocyanin content predicts 86% of the PMAX variability. Fig. 3Electron injection diagram for the DSSC. Light transports electrons to higher levels where they generate power as they flow through a load. The iodide/tri-iodide mediator forms a regenerative cycle that transfers electrons to the dye and then accepts the negatively charged electrons from the counter electrode (adapted from ICE Publication 98–100). 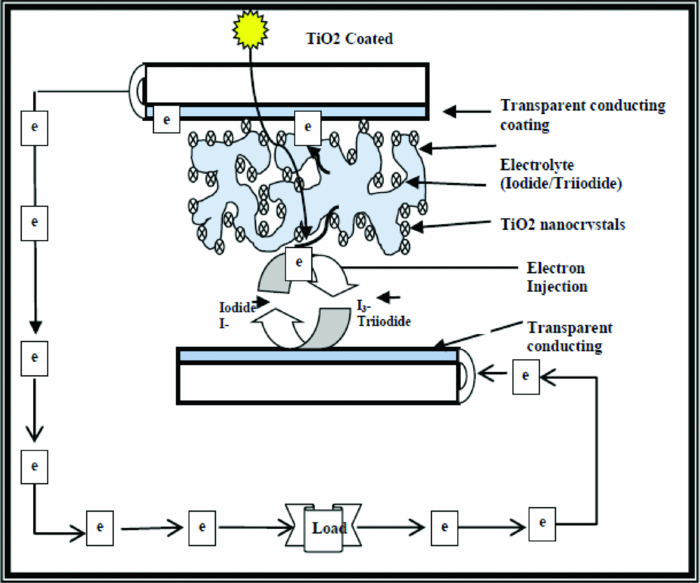 A limitation of this study is a significant gap in the data between dyes with low to moderate anthocyanin concentrations and dyes with high concentrations. To optimize the power law model, more experiments need to be done with a group of fruits, vegetables, or plants with anthocyanin contents in the range of 100 to 300 mg/dl (Table 4).21 In this study, an independent variable was selected as the fruit-specific concentration of anthocyanin in 100 g of different species. An alternate way to investigate the impact of anthocyanin content is focusing the experiment on standard variations of anthocyanin content in a single organic dye. To the best of our knowledge, not a lot of commercially organic dyes are available for this kind of study. This approach provides a more controlled setting that allows adjustment for anthocyanin content and measure the impact other variables like pH, temperature, light, presence of other phenolic compounds, enzymes, metal ions, sugars, ascorbic acid, and oxygen. E-163 is a color-free flowing powder made from an aqueous anthocyanin extracted from black carrot. Malto Dextrin is used as a carrier and is soluble in water and suspensible in oil. This product has color strength of 0.38 OD at 520 nm with dilution 1:1000 in citric and sodium citrate pH 3 buffer. Less standardized products are commercially available for purple sweet potato, red cabbage, and red radish (Qingdao Bio-Tech Resource Co., Ltd. Shandong, China). Table 4Main anthocyanins in some fruits with anthocyanin content between 150 and 300 mg 100 g−1 (from database: USDA 2007) (Refs. 9, 10, 11, 12, 13, 14, 15, 16, 17, 18, 19, 20); Cyanidin (Cy), Pelargonidin (Pg), Malvidin (Mv), Petunidin (Pt), Peonidin (Pn), and Delphinidin (Dp).
A power law predictive model is the first step to finding organic anthocyanin sources in nature with not only the highest concentration of anthocyanin molecules but also a higher proportion of ready-to-be-activated molecules. In choosing organic material to construct a DSSC, it is important to consider these two factors for the organic dye. The absorption spectrum of the anthocyanin and its anchorage to the surface of the TiO2 are other important parameters that determine the efficiency of the cell. Carbonyl and hydroxyl groups present in the anthocyanin molecule can be bound to the surface of a porous TiO2 film. This improves the electron transfer from the anthocyanin molecule to the conduction band of TiO2. Previous studies reported that anthocyanins from various plants give different sensitizing performances.4 However, there is currently no acceptable explanation for these results. Suggested models in the current study did not look at the structural differences of the anthocyanins found in different test fruits (Table 1). The anthocyanidins are hydroxylated and methoxylated derivates of phenyl-2-benzopyrylium or flavylium salts, regarded as flavonoid compounds.22 Their basic structure of the aglycone is a C-6 (A-ring)-C-3 (C-ring)-C-6 (B-ring) carbon skeleton (Fig. 4), figuring a chromane ring bearing a second aromatic ring B in position 2. There are 17 known naturally occurring anthocyanidins, but only six of them are common in higher plants – cyanidin (Cy), peonidin (Pn), pelargonidin (Pg), malvidin (Mv), delphinidin (Dp), and petunidin (Pt), with cyanidin (Cy) being the most common.22, 23, 24 Fruits used in this study can be divided into two main groups; black raspberry, cherry, blackberry, and raspberry with cyanidin as the main anthocyanin and the second group of blueberry, cranberry, strawberry, and red grape with other types of anthocyanins (Table 1). This provides a broad variety of anthocyanins in the models. The three nonmethylated anthocyanidins: cyanidin (Cy), delphinidin (Dp) and pelargonidin (Pg) are the most widespread in nature and also in fruits tested in this study. Most study species contain a limited number of anthocyanin pigments, but in some cases like red grapes contain a mixture of more than 20 pigments.25 This impurity is another confounding factor in the models. Fig. 4Chemical structures of main anthocyanins in this study of fruits: 1 – pelargonidin (Pg), 2 – cyaniding (Cy), 3 – peonidin (Pn), 4 – delphinidin (Dp), 5 – petunidin (Pt), 6 – malvidin (Mv) (adapted from Ref. 9). 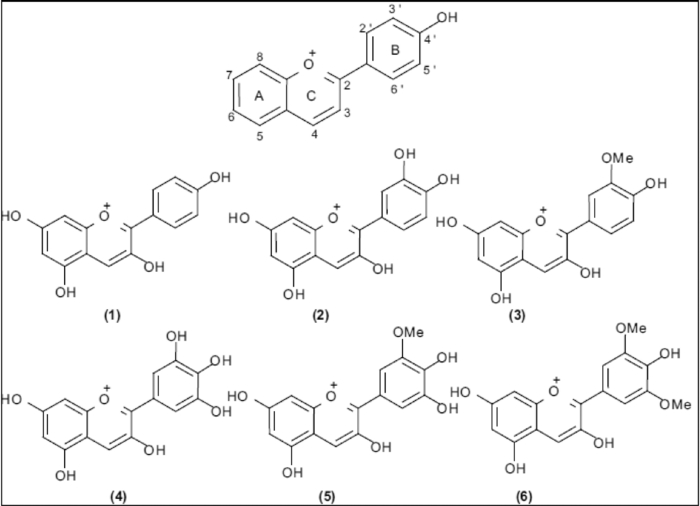 Other unmeasured factors, such as the pH, temperature, light, presence of other phenolic compounds, enzymes, metal ions, sugars, ascorbic acid, and oxygen might have impact on the stability of anthocyanins in fruit species tested in this study. In aqueous solution, anthocyanins undergo structural transformations that are pH-dependent.26 At pH below 2, anthocyanins primarily exist in the form of the red flavylium cation. Hydration of the flavylium cation gives the colorless carbinol pseudobase at pH values ranging from 3 to 6. This can further equilibrate to an open form, the colorless chalcone pseudobase.27 Temperature has been reported to induce a slow destruction of the pigments.28 When temperature is increased, anthocynins can be transformed into an unstable formation of chalcone, and the chalcone is further degraded to brown products. Light is another confounding factor that has a differential impact on anthocyanin concentration.29 Intensity and type of the color of anthocyanins is affected by the number of hydroxyl and methoxyl groups: if more hydroxyl groups, then the color goes toward a more bluish shade; if more a methoxyl group, then redness is increased.9 This structural variation in organic dyes is another potential cofounder in the models. Furthermore, both efficiency and performance of DSSCs depend on their anthocyanin dye absorption spectra. The anthocyanin absorption spectra depend on pH. At pH < 2, anthocyanins show maximum absorption both in the ultraviolet region (260 to 280 nm) and in the visible region (490 to 540 nm). This causes confounding variation in intensity and range of the light absorption of the extract on TiO2 and the rate of interaction between TiO2 and anthocyanin that leads to a change in charge transfer. Anthocyanin pigments undergo reversible structural transformations with a change in pH manifested by different absorbance spectra. The colored oxonium form predominates at pH 1.0 and the colorless hemiketal form at pH 4.5. Furthermore, the variability in the sample extraction media (water, acidic water, acidic organic solvent, etc.), chemical properties of anthocyanins, and co-pigmentation of anthocyanins with other secondary metabolites present in the sample solution can cause an inaccurate correlation between absorbance and actual anthocyanin concentration.30 The proposed models in this study do not provide any specificity as far as the molecular identity of the anthocyanin composition present in the material is concerned. Moreover, anthocyanins in fruits like the blueberry extract (cyanidin and delphinidin) have a shorter distance between the dye skeleton and the point connected to TiO2 surface compared to other fruits. This could facilitate an electron transfer from anthocyanin with cyanidin in the extract to the TiO2 surface and could be accounted for a better performance of dye extract sensitization with the same density of anthocyanin.31 Based on the current experiment, the efficiency of the blueberry-based cell was significantly higher than the strawberry-based device. This might also be due to a larger number of ready molecules, a broader range of light absorption by the extract on the TiO2, and the higher rate of interaction between the TiO2 and anthocyanin molecules in the blueberry that leads to better charge transfer. Moreover, anthocyanins from the strawberry appear to have longer R groups compared to that of blueberry, resulting in a stronger steric hindrance for the anthocyanin molecules to bond with the oxide surface. The steric hinderance also prevents the anthocyanin molecules from effectively arraying on the TiO2 film. Hence, a deficiency in electron transfer from the dye molecules to the conducting band of the TiO2 occurs. More information about the structural variation of the anthocyanin molecules from different plants will allow future studies to optimize current models. The concentration of the electrolyte solution is another factor that should be energetically well-suited to the dye.6 In this study, the concentration of the electrolyte solution was fixed at 0.05 M tri-iodide in water-free ethylene glycol. For future work on anthocyanin dyes, such as raspberries, blueberries, and beetroot, the optimal concentration of the electrolyte needs to be quantitatively established by varying the concentration of potassium iodide or iodine and observing the changes in the photocurrent. Furthermore, a cell that produces a large photocurrent contains an anthocyanin type that is energetically well-suited to the titanium dioxide in that it has a conduction energy level that is slightly higher than that of the titanium dioxide. The current experiment did not focus on the differential energy level of the anthocyanin dyes from different fruits. In all regression models, the cherry-based cell was a relative outlier. It seems that the unmeasured variables, such as contaminants and pH, had a major confounding impact on the relationship between the anthocyanin concentration and the solar cell performance for the cherry-based cell. Further research needs to be performed to add additional variables to the model and to test any model with different types of known and unknown organic dyes. AcknowledgmentsI am grateful to all of my science and mathematics teachers: Bruce Greenspan, Gilana Reiss, Thomas Scott, and Stephen Young for what they have taught me that shaped my intellectual foundation to design and complete this research work. I also appreciate others in science and mathematics departments especially Dr. Philip Jeffery and Lyubomir Detchkov from Hunter College High School. ReferencesJ. M. Kong, L. S. Chia, N. K. Goh, T. F. Chia, and R. Brouillard,
“Analysis and biological activities of anthocyanins,”
Phytochemistry, 64
(5), 923
–933
(2003). http://dx.doi.org/10.1016/S0031-9422(03)00438-2 Google Scholar
N. J. Cherepy, G. P. Smestad, M. Gratzel, and J. Z. Zhang,
“Ultrafast electron injection: Implications for a photoelectrochemical cell utilizing an anthocyanin dye-sensitized TiO2 nanocrystalline electrode,”
J. Phys. Chem. B, 101
(45), 9342
–9351
(1997). http://dx.doi.org/10.1021/jp972197w Google Scholar
S. Hao, J. Wu, Y. Huang, and J. Lin,
“Natural dyes as photosensitizers for dye-sensitized solar cell,”
Sol. Energy, 80
(2), 209
–214
(2006). http://dx.doi.org/10.1016/j.solener.2005.05.009 Google Scholar
A. S. Poloa and N. Y. Murakami Iha,
“Blue sensitizers for solar cells: Natural dyes from calafate and jaboticaba,”
Sol. Energy Mater. Sol. Cells, 90
(13), 1936
–1944
(2006). http://dx.doi.org/10.1016/j.solmat.2006.02.006 Google Scholar
K. Wongchareea, V. Meeyooa, and S. Chavadejb,
“Dye-sensitized solar cell using natural dyes extracted from rosella and blue pea flowers,”
Sol. Energy Mater. Sol. Cells, 91
(7), 566
–571
(2007). http://dx.doi.org/10.1016/j.solmat.2006.11.005 Google Scholar
G. Calogero and G. Di Marcoa,
“Red Sicilian orange and purple eggplant fruits as natural sensitizers for dye-sensitized solar cells,”
Sol. Energy Mater. Sol. Cells, 92
(1), 1341
–1346
(2008). http://dx.doi.org/10.1016/j.solmat.2008.05.007 Google Scholar
G. R. A. Kumaraa, S. Kanekoa, M. Okuyaa, B. Onwona-Agyemanb, A. Konnoa, and K. Tennakoneb,
“Shiso leaf pigments for dye-sensitized solid-state solar cell,”
Sol. Energy Mater. Sol. Cells, 90
(9), 1220
–1226
(2006). http://dx.doi.org/10.1016/j.solmat.2005.07.007 Google Scholar
E. Yamazaki, M. Murayamaa, N. Nishikawaa, N. Hashimotoa, M. Shoyamaa, and O. Kuritaa,
“Utilization of natural carotenoids as photosensitizers for dye-sensitized solar cells,”
Sol. Energy, 81
(4), 512
–516
(2007). http://dx.doi.org/10.1016/j.solener.2006.08.003 Google Scholar
M. Horbowiczi, R. Kosson, A. Grzesiuk, and H. Debski,
“Anthocyanins of fruits and vegetables—their occurance, analysis and role in human nutrition,”
Vegetable Crops Research Bulletin, 68 5
–22
(2008). http://dx.doi.org/10.2478/v10032-008-0001-8 Google Scholar
A. A. Franke, L. J. Custer, C. Arakaki, and S. P. Murphy,
“Vitamin C and flavonoid levels of fruits and vegetables consumed in Hawaii,”
J. Food Compost. Anal., 17 1
–35
(2004). http://dx.doi.org/10.1016/S0889-1575(03)00066-8 Google Scholar
L. Gao and G. Mazza,
“Quantitation and distribution of simple and acylated anthocyanins and other phenolics in blueberries,”
J. Food Sci., 59 1057
–1059
(1994). http://dx.doi.org/10.1111/j.1365-2621.1994.tb08189.x Google Scholar
X. Wu, G. R. Beecher, J. M. Holden, D. B. Haytowitz, S. E. Gebhardt, and R. L. Prior,
“Concentrations of anthocyanins in common foods in the United States and estimation of normal consumption,”
J. Agric. Food Chem., 54 4069
–4075
(2006). http://dx.doi.org/10.1021/jf060300l Google Scholar
J. M. Harnly, R. Doherty, G. R. Beecher, J. M. Holden, D. B. Haytowitz, and S. Bhagwat,
“Flavonoid content of U.S. fruits, vegetables, and nuts,”
J. Agric. Food Chem., 54 9966
–9977
(2006). http://dx.doi.org/10.1021/jf061478a Google Scholar
H. J. Fan-Chiang and R. E. Wrolstad,
“Anthocyanin pigment composition of blackberries,”
J. Food Sci., 70 C198
–C202
(2005). http://dx.doi.org/10.1111/j.1365-2621.2005.tb07125.x Google Scholar
B. Ancos, E. Gonzalez, and M. P. Cano,
“Differentiation of raspberry varieties according to anthocyanin composition,”
Z. Lebensm. Unters Forsch, 208
(1), 33
–38
(1999). http://dx.doi.org/10.1007/s002170050371 Google Scholar
W. Mullen, A. J. Stewart, M. E. J. Lean, P. Gardner, G. G. Duthie, and A. Crozier,
“Effect of freezing and storage on the phenolics, ellagitannins, flavonoids, and antioxidant capacity of red raspberries,”
J. Agric. Food Chem., 50 5197
–5201
(2002). http://dx.doi.org/10.1021/jf020141f Google Scholar
C. Garcia-Vigera, P. Zafrilla, and F. A. Tomás-Barberán,
“The use of acetone as an extraction solvent for anthocyanins from strawberry fruit,”
Phytochem. Anal., 9 274
–277
(1998). Google Scholar
S. Y. Wang, W. Zheng, and G. Galleta,
“Cultural system affects fruit quality and antioxidant capacity in strawberries,”
J. Agric. Food Chem., 50 6534
–6542
(2002). http://dx.doi.org/10.1021/jf020614i Google Scholar
S. Y. Wang and H.-S. Lin,
“Compost as a soil supplement increases the level of antioxidant compounds and oxygen radical absorbance capacity in strawberries,”
J. Agric. Food Chem., 51 6844
–6850
(2003). http://dx.doi.org/10.1021/jf030196x Google Scholar
E. Revilla, J.-M. Ryan, and G. Martin-Ortega,
“Comparison of several procedures used for the extraction of anthocyanins from red grapes,”
J. Agric. Food Chem., 46 4592
–4597
(1998). http://dx.doi.org/10.1021/jf9804692 Google Scholar
M. Andersen and M. Jordheim,
“Anthocyanins,”
Encyclopedia of Life Sciences, John Wiley & Sons Ltd., The Atrium/Southern Gate, Terminus Road, Chichester, West Sussex PO19 8SQ
(2010). Google Scholar
A. Eder, Pigments in Food Analysis, HPLC, 845
–880 Marcel Dekker, New York
(2000). Google Scholar
J. M. Kong, L. S. Chia, N. K. Goh, T. F. Chia, and R. Brouillard,
“Analysis and biological activities of anthocyanins,”
Phytochemistry, 64 923
–933
(2003). http://dx.doi.org/10.1016/S0031-9422(03)00438-2 Google Scholar
J. B. Harborne, Phenolic Compounds in Phytochemical Methods – A Guide to Modern Techniques of Plant Analysis, 66
–74 Chapman and Hall, London
(1998). Google Scholar
M. N. Clifford,
“Anthocyanins – nature, occurrence and dietary burden,”
J. Sci. Food Agric., 80 1063
–1072
(2000). http://dx.doi.org/10.1002/(SICI)1097-0010(20000515)80:7<1063::AID-JSFA605>3.0.CO;2-Q Google Scholar
R. Brouillard,
“Chemical structure of anthocyanins,”
Anthocyanins as Food Colors, 1
–40 Academic, New York
(1982). Google Scholar
G. Takeoka and L. Dao,
“Anthocyanins,”
Methods of Analysis for Functional Foods and Nutraceuticals, 219
–241 CRC press, Boca Boton
(2002). Google Scholar
F. Delgado-Vargas, A. R. Jiménez, and O. Paredes-López,
“Natural pigments: Carotenoids, anthocyanins, and betalains – characteristics, biosynthesis, processing and stability,”
Crit. Rev. Food Sci Nutr., 40 173
–289
(2000). http://dx.doi.org/10.1080/10408690091189257 Google Scholar
N. Palamidis and P. Markakis,
“Stability of grape anthocyanin in a carbonated beverage,”
J. Food Sci., 40 1047
–1048
(1975). http://dx.doi.org/10.1111/j.1365-2621.1975.tb02264.x Google Scholar
P. Bridle and C. F. Timberlake,
“Anthocyanins as natural food colours – selected aspects,”
Food Chem., 58 103
–109
(1997). http://dx.doi.org/10.1016/S0308-8146(96)00222-1 Google Scholar
K. Sayama, S. Tsukagoshi, T. Mori, K. Hara, Y. Ohga, A. Shipou, Y. Abe, S. Suga, and H. Arakawa,
“Efficient sensitization of nanocrystalline TiO2 films with cyanine and merocyanine organic dyes,”
Solar Energy Mater. Solar Cells, 80 47
–71
(2003). http://dx.doi.org/10.1016/S0927-0248(03)00113-2 Google Scholar
|


